Case Study 19
Carbon and water footprints of Category 2 MBM fertiliser
-
Carbon and water footprint available for Cat 2 MBM
-
Fertiliser is optimum reuse of Cat 2 MBM
-
Positive comparison with synthetic fertiliser (based on limited data)
-
Could help farmers reach net zero targets
A report by Blonk Consultants in collaboration with EFPRA analysed the carbon and water footprints of Category 2 MBM.
The results show that these fertilisers could potentially offer environmental advantages compared to synthetic fertilisers with equivalent nutrient profiles. Fertiliser with a lower carbon and water footprint can help farmers achieve net zero and other sustainability targets.
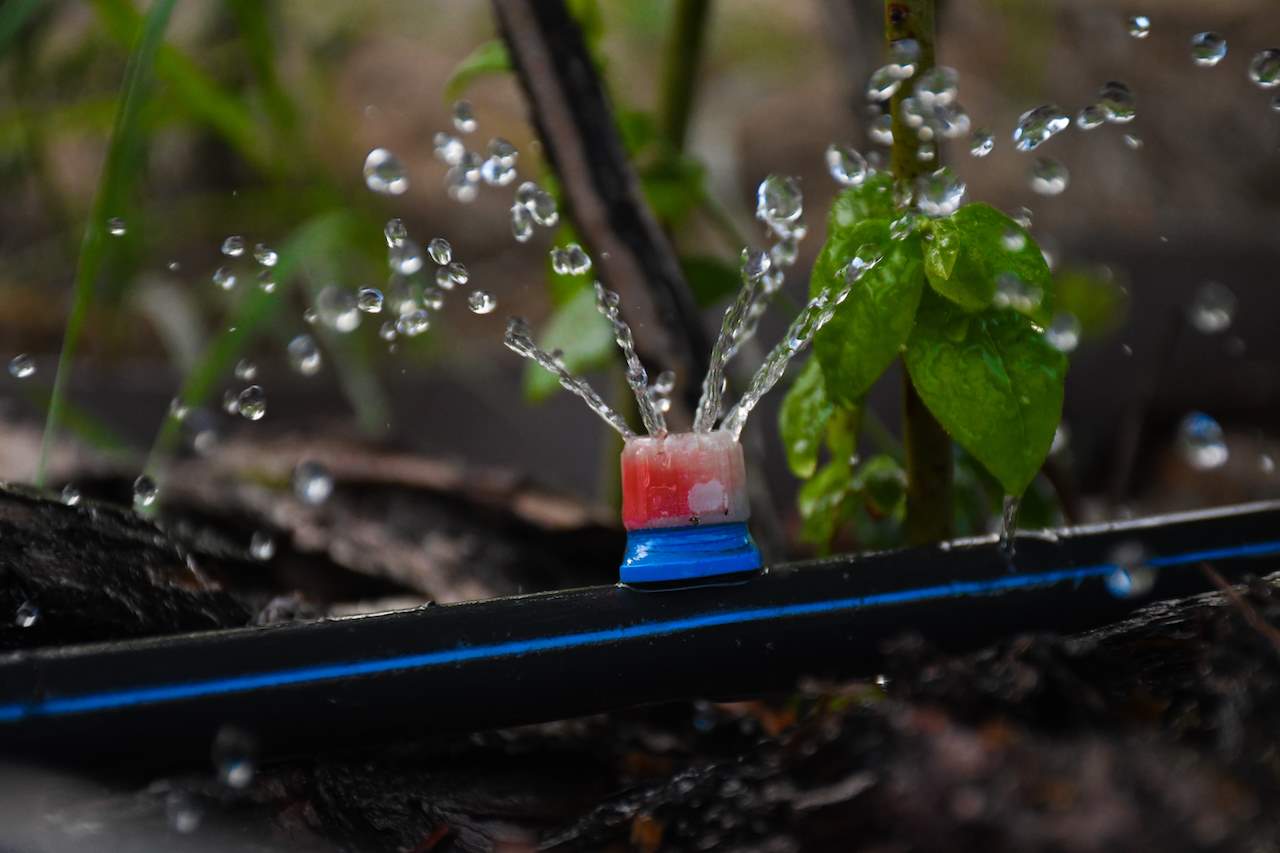
Category 2 Meat and Bone Meal (Cat 2 MBM) contains high levels of nitrogen and phosphorous, and is a suitable feedstock for fertiliser under European Animal by-products legislation. For use as fertiliser, it is blended with other organic materials to achieve the desired agronomic performance. Fertiliser is the most sustainable use for Category 2 materials as they cannot return to the food chain directly, the alternative is to use as a biomass fuel.
Please note, the report deals specifically with the carbon and water footprint of Cat 2 MBM, not blended fertiliser products that contain Cat 2 MBM.
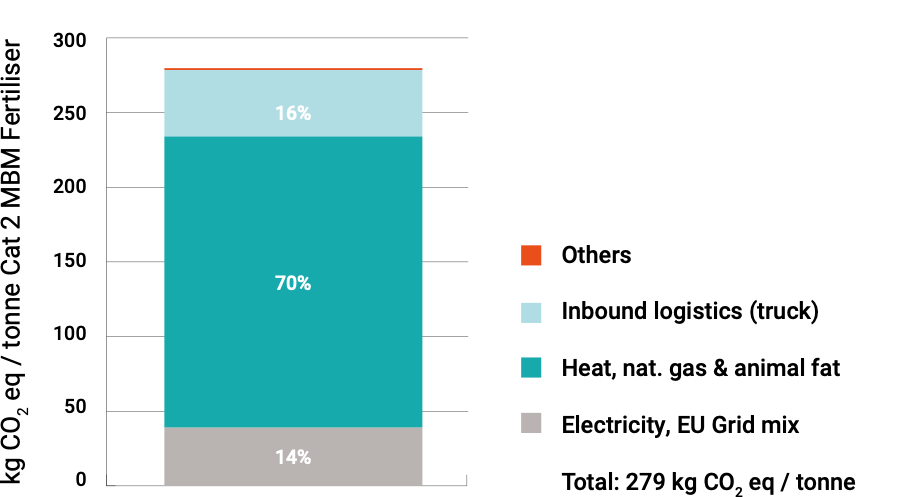
Carbon Footprint (Global Warming Contribution)
279 kg CO2 eq. are emitted per tonne of Cat 2 MBM produced. Heat use accounts for 70% of the total climate change impact. Around 95% of heat generated is from natural gas, the remainder is from animal fat which has an insignificant contribution to climate change. Inbound logistics and electricity make up the other contributions.
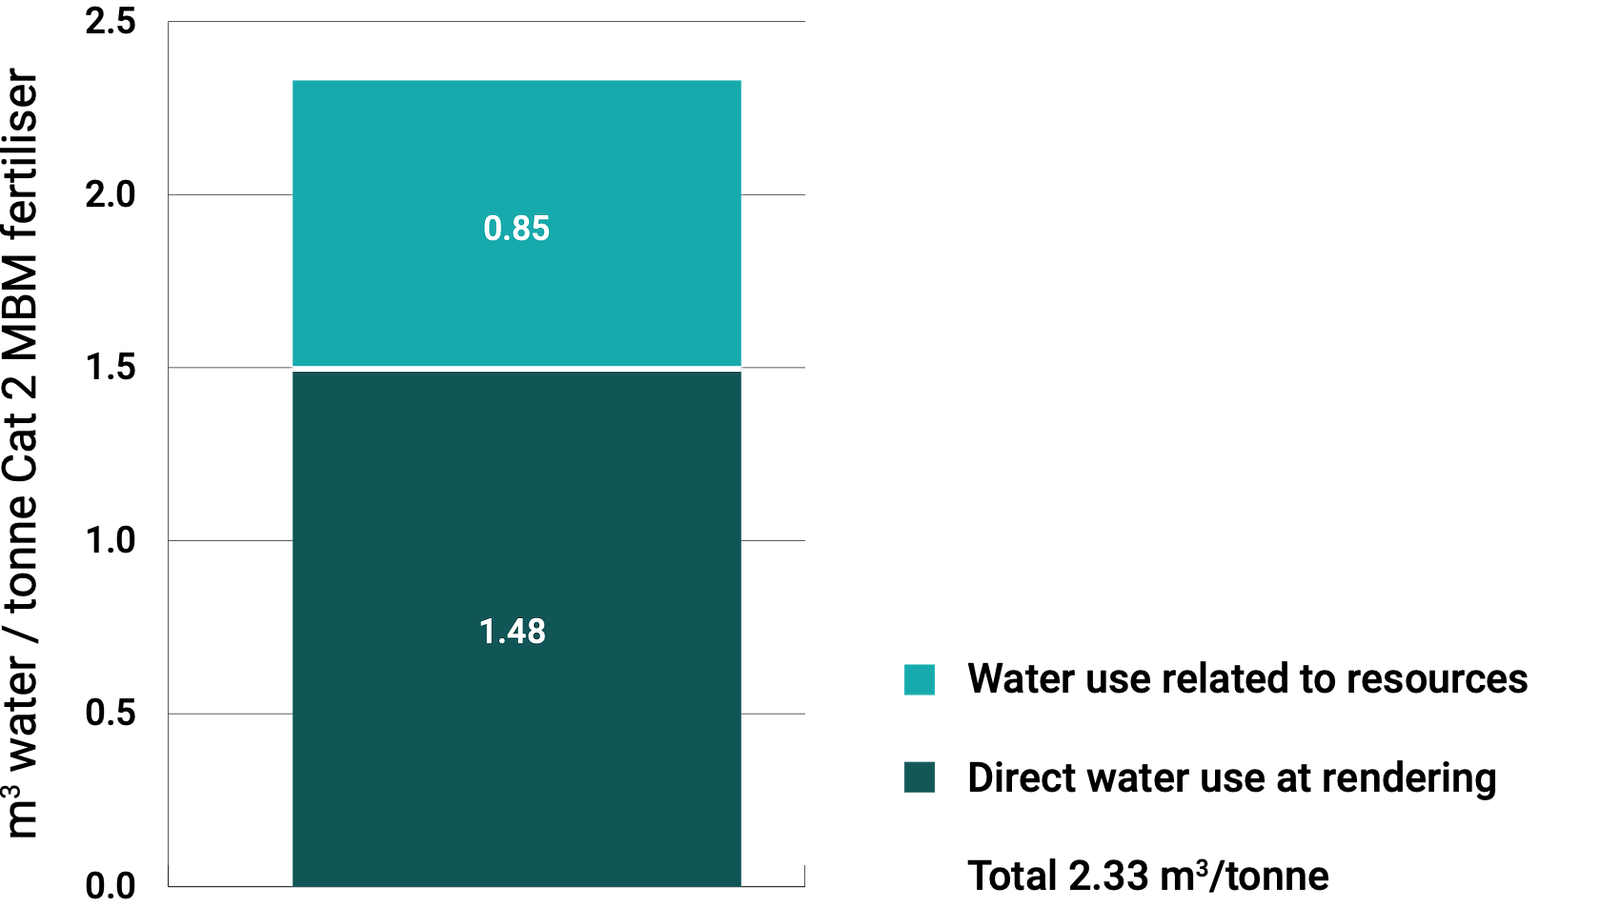
Water Footprint
2.33m3 of water is used per tonne of Cat 2 MBM produced. The rendering only contribution is 1.48m3/tonne and the rest is water used for energy production. Water is sourced from tap, surface and ground water in various proportions at each production site. Assuming that tap water comprises 65% ground water and 35% surface water, and using the primary water use data from EFPRA members, the study found that about 85% of water use comes from ground water aquifers and 15% from surface water.
The study also used the ReCiPe LCA impact assessment method. Based on this approach, the study found that the water consumption is only 2.12m3/tonne Category 2 MBM produced.
The comparison shows that Category 2 MBM fertiliser has a 35% lower global warming impact and 17% lower water consumption impact than a macronutrient equivalent synthetic fertiliser at the point of production”
Comparison with Synthetic Fertilisers
The Category 2 MBM fertiliser impacts were compared to a synthetic fertiliser, at the production point (excluding usage), based on macronutrient equivalency for nitrogen (N) and phosphorous (P) content. The MBM average content was calculated as 9.6% N and 5.2% P at 98% dry mater content. A synthetic equivalent fertiliser was derived based on commonly used conventional N and P fertilisers (mixes of ammoniacol N compounds and phosphoric acid). The results are shown in the two graphs.


Limitations
The most significant emissions associated with agriculture are related to the application of fertilisers and the chemical / nutrient interactions with the soil which eventually release greenhouse gases and other emissions. These are excluded from the study. Despite using high quality, primary data for Category 2 MBM, the representativeness of the synthetic alternative is less reliable, based on secondary information from a commercial LCA database. The comparison only serves as a benchmark to provide an indication of the environmental impact of the alternatives and cannot be used to derive meaningful conclusions from a life cycle viewpoint.
Methodology
Following positive results from the LCA of Category 3 rendered products (see Case Study 3), EFPRA extended the study to the carbon and water footprints of fertiliser produced from Category 2 MBM.
The impact of Category 2 derived products is attributed to transportation from slaughterhouse to rendering facility, and rendering operations. Category 2 ABPs are “residual material” of zero value at the production point, being inappropriate for human or animal consumption. Upstream animal farming and slaughterhouse activities are excluded.
Category 2 rendering produces MBM and fat, the rendering impact was allocated to both co-products, based on their ex-work prices, for both dry and wet rendering lines.
EFPRA members from France, the Netherlands, Spain, Finland and Italy provided data from seven production sites for three consecutive years of operation, 2020-2022. This included:
-
Mass balances of raw material inputs and product outputs
-
Inbound logistics from slaughterhouse to rendering
-
Processing energy requirements (thermal and electrical)
-
Water use requirements
-
Auxiliary material use
-
Wastewater treatment
For Category 2 raw material, mass balances at the slaughterhouse were based on production point prices to derive economic allocation factors. Prices for co-production of Category 2 MBM and fat were also collected.
The economic allocation approach shifts more weight to the production of fat at a share of around 20% MBM: 80% fat. Only the MBM fertiliser impact was reported in this study.